IT Infrastructure Monitoring
Hiển thị các bài đăng có nhãn IT Infrastructure Monitoring. Hiển thị tất cả bài đăng

Hướng dẫn triển khai Zabbix 8 trên Docker

Tình hình là bữa giờ có một số bạn học viên nhờ hướng dẫn triển khai Zabbix 8.0 trên Docker.

Sau khi tôi tìm hiểu qua thì phiên bản Zabbix 8.0 này có nhiều tính năng hay ho quá. Thôi nay tranh thủ quất thử luôn :))

Bài viết này sẽ hướng dẫn các bạn triển khai Zabbix 8.0 trên Docker, việc cài đặt Zabbix Server trở nên cực kỳ dễ dàng, nhanh chóng chỉ trong vòng vài phút.

Zabbix 8.0 LTS (dự kiến phát hành vào Q2 năm 2026) là một phiên bản rất được mong đợi, đánh dấu bước mở rộng quan trọng của Zabbix từ hệ thống giám sát truyền thống sang nền tảng quan sát toàn diện (full observability). Phiên bản này mang đến hỗ trợ OpenTelemetry, khả năng giám sát logs real time, Core hệ thống được thiết kế lại và khả năng mở rộng được cải thiện. Các nâng cấp đáng chú ý khác bao gồm ứng dụng di động, xử lý sự kiện theo kiểu SIEM, giám sát mạng dựa trên NetFlow, tăng cường kiểm soát bảo mật và hệ thống dashboard mới trực quan với các báo cáo chi tiết hơn. Phiên bản này định vị Zabbix như một giải pháp observability mã nguồn mở toàn diện.

>>> Tham khảo chi tiết: https://www.zabbix.com/roadmap#v8_0_LTS

Zabbix là một trong những giải pháp giám sát mã nguồn mở đã được kiểm chứng, đáng tin cậy, cung cấp khả năng giám sát cho máy chủ, ứng dụng, mạng và môi trường đám mây.

Docker cung cấp các môi trường cô lập, cập nhật đơn giản và kiểm soát phiên bản dễ dàng.

Khi kết hợp với Docker + Zabbix, toàn bộ hệ thống Zabbix (server, frontend, database(PostgreSQL/MySQL) và agent) có thể được triển khai chỉ với vài lệnh. 

Việc kết hợp này mang đến một giải pháp giám sát nhẹ, linh hoạt và dễ triển khai, giúp cung cấp khả năng giám sát có thể mở rộng mà không phải đau đầu với việc cài đặt thủ công.

Hướng dẫn này sẽ mô tả Zabbix Docker là gì, cách triển khai Zabbix Docker bằng Docker Compose, và cách Zabbix Docker giúp việc giám sát trở nên dễ dàng hơn trong các môi trường được container hóa.

IT Infrastructure Monitoring with Zabbix - Part02

Configure Zabbix Agent: Active vs. Passive ?


Zabbix Agent is installed on servers or client-side devices. Thereby, Zabbix Agent will collect the necessary information from the client computer that needs to be monitored, checked and collected data related to CPU, Memory, Disk and Network interface… or other administrator requirements, then send the results back to Zabbix Server for storage and visualization. It runs on any modern operating system and is very flexible because its functionality can be extended with scripts and modules.
 
First, you need to understand about Active vs Passive Zabbix Agent mode.

See this:

Active vs Passive agent connection

When using a Zabbix agent in active mode, it will connect to the Zabbix server via port 10051 to retrieve configuration and send data. This is a great feature that allows an active Zabbix agent to work behind the firewall and to offload the Zabbix server in large environments.

On the other hand, if you use a Zabbix agent in passive mode, Zabbix server will initiate a connection via port 10050 and retrieve data from the agent. The Zabbix server will do this for every metric (item) every few minutes – which is very inefficient! Because of this, active mode is more recommended.

An additional advantage of the Zabbix agent in active mode is that it can read logs from the device and that is not possible if the Zabbix agent is used in passive mode.

Because, Zabbix-agent is quite easy to install so I won't mention it here.


In this tutorial, I will show you how to configure  Zabbix agent and add host to monitoring system.

1/ Configure Zabbix agent on Linux OS:

Automation configure Zabbix Agent with bash script:

IT Infrastructure Monitoring with Zabbix - Part01

Take-note: step by step how to install Zabbix-Server.

Zabbix - Easy Steps for Installation and Configuration:

This is my topo:


Part 01 of  IT Infrastructure Monitoring with Zabbix. In this article:

- server01: Zabbix

- server02: MySQL 

Let's go!

# server01

vim /etc/hosts
Add this:

172.16.2.201 vnsmysql01.infra.lecuong.info
172.16.2.203 vnszabbix01.infra.lecuong.info

Add the Zabbix Repository:

Zabbix v6


rpm -Uvh https://repo.zabbix.com/zabbix/6.0/rhel/9/x86_64/zabbix-release-latest.el9.noarch.rpm

Zabbix v7


rpm -Uvh https://repo.zabbix.com/zabbix/7.0/rocky/9/x86_64/zabbix-release-latest.el9.noarch.rpm


Install Zabbix Server, Frontend, and Agent:

Giải pháp giám sát hạ tầng mạng miễn phí

Chào các bạn,

Tiếp theo loại bài về GIẢI PHÁP GIÁM SÁT HẠ TẦNG MẠNG MIỄN PHÍ với:

  • Nagios
  • PNP4nagios
  • Check_mk
  • ....
Trong bài viết này, tôi sẽ giới thiệu về việc Tích hợp các dữ liệu monitoring vào database.

Để thực hiện việc này, chúng ta sử dụng một addon có tên là NDOUtils
Sau đây là các bước tích hợp:

  • Cài đặt & cấu hình MySQL
  • Thay đổi các thông số kernel
  • Cài đặt và cấu hình ndoutils-2.1.3
  • Khai báo Ndoutils vào Nagios
  • Kiểm tra

how to install rrdtool 1.7.0 centos

Hệ thống monitoring Nagios (kết hợp check_mk, pnp4nagios) sử dụng rrdtool để vẽ biểu đồ thông tin hệ thống.


Trong một trường hợp tôi tình cờ phát hiện graph theo dõi băng thông trên một vài interfaces bị lỗi không thể hiển thị:


Sau khi kiểm tra, tôi đã fix lỗi thành công:


Nguyên nhân là do rrdtool v1.3.8 không tương thích với một vài tính năng trên Nagios core, check_mk core, pnp4nagio mới nhất.

Trong bài viết này, tôi chia sẻ các bước cài đặt rrdtool v1.7.0 (mới nhất hiện nay 2017.06.05).

Download rrdtool v1.7.0 : http://martybugs.net/linux/rrdtool/


Cài đặt các gói cần thiết: 
yum install glib
yum install cairo-devel libxml2-devel pango-devel pango libpng-devel freetype freetype-devel libart_lgpl-devel 
yum install perl-devel
yum install perl-CPAN

./configure --disable-tcl
----------------------------------------------------------------
Config is DONE!
          With MMAP IO: yes
          With Locking: yes
       Build rrd_graph: yes
     Build rrd_restore: yes
       Static programs: no
          Perl Modules: perl-piped perl-shared
           Perl Binary: /usr/bin/perl
          Perl Version: 5.10.1
          Perl Options: PREFIX=/opt/rrdtool-1.7.0 INSTALL_BASE= LIB=/opt/rrdtool-1.7.0/lib/perl/5.10.1
          Ruby Modules:
           Ruby Binary: no
          Ruby Options: sitedir=/opt/rrdtool-1.7.0/lib/ruby
    Build Lua Bindings: no
    Build Tcl Bindings: no
 Build Python Bindings: no
        Build examples: yes
       Build rrdcached: yes
          Build rrdcgi: yes
       Build librrd MT: yes
           Use gettext: yes
           With libDBI: no
         With librados: no
          With libwrap: no
      With systemd dir:
             Libraries: -lpng -lm  -lglib-2.0   -lpangocairo-1.0 -lpango-1.0 -lcairo -lgobject-2.0 -lgmodule-2.0 -lgthread-2.0 -lrt -lglib-2.0   -lxml2
Type 'make' to compile the software and use 'make install' to
install everything to: /opt/rrdtool-1.7.0.
       ... that wishlist is NO JOKE. If you find RRDtool useful
make me happy. Go to http://tobi.oetiker.ch/wish and
place an order.
                               -- Tobi Oetiker <tobi@oetiker.ch>
----------------------------------------------------------------


make
make install

TCL is disabled, as compilation of some of the TCL components for RRDTool 1.2.12 will otherwise fail on RedHat 9.
Run ./configure --help for more information on configuration options.

The default installation location is /usr/local/rrdtool-VERSION, so make some symbolic links to the executables:

ln -sf /opt/rrdtool-1.7.0/bin/rrdtool /usr/bin/rrdtool
ln -sf /opt/rrdtool-1.7.0/bin/rrdupdate /usr/bin/rrdupdate
ln -sf /opt/rrdtool-1.7.0/bin/rrdcgi /usr/bin/rrdcgi

The RRDTool Perl library simplifies things when using RRDTool from a Perl script, so to compile and install the Perl library for RRDTool:

make site-perl-install

----------------!
service nagios restart
service httpd restart
cmk -R 

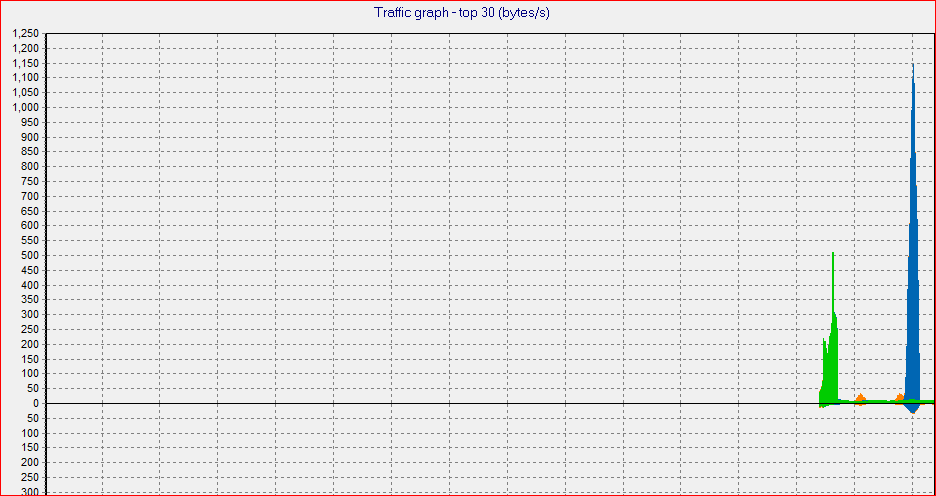
Mikrotik realtime traffic monitoring

GIÁM SÁT BĂNG THÔNG TRÊN ROUTER MIKROTIK

Tôi thường triển khai hệ thống wifi bằng router Mikrotik cho các quán cafe vì độ ổn định, giá tốt và hiệu quả. Vì có nhiều anh em hỏi cách theo dõi băng thông trên Mikrotik để...chống trộm ^^!

Nay tôi viết hướng dẫn nho nhỏ này để giải đáp thắc mắc. :)


1/ Cấu hình các thông số trên router Mikrotik cho phép gửi traffic:


/user
group add name=sniffer policy="ssh,read"
add address=172.16.1.0/24 disabled=no group=sniffer name=sniffer 


GIẢI PHÁP GIÁM SÁT DATABASE ORACLE miễn phí


GIẢI PHÁP GIÁM SÁT HẠ TẦNG MẠNG MIỄN PHÍ VỚI NAGIOS

Tiếp theo loạt bài về giải pháp giám sát với Nagios. Trong bài viết này, tôi sẽ hướng dẫn cấu hình các thông số trên Nagios (Check_MK) để giám sát cơ sở dữ liệu Oracle ở môi trường Linux/Unix (AIX)

Về các thông số sẽ lấy từ db Oracle như sau:


  • oracle_instance Check various aspects of an Instance
  • oracle_asm_diskgroup Check various aspects of ASM Disk-Groups
  • oracle_dataguard_stats Check various aspects of Data-Guard state
  • oracle_jobs Check various aspects of Scheduler Jobs
  • oracle_locks Check various aspects of Instance Locks
  • oracle_logswitches Check various aspects of Logswitches
  • oracle_longactivesessions Check various aspects of Long Active Sessions
  • oracle_performance Ger various Performance data from an Instance
  • oracle_processes Check various aspects of ORACLE Processes
  • oracle_recovery_area Check various aspects of the Fast Recovery Area
  • oracle_recovery_status Check various aspects of the Recovery State
  • oracle_rman_backups Check various aspects of RMAN Backups
  • oracle_sessions Check various aspects of Sessions
  • oracle_tablespaces Check various aspects of Tablespaces
  • oracle_undostat Check various aspects of Undo Statistics

......

Để giám sát chi tiết các thông số trên host, chúng ta cần cần cài đặt Agent tương ứng với từng OS là Linux/AIX/Windows. Việc cài đặt Agent lên host khá đơn giản nên tôi sẽ không đề cập nhiều, chỉ tập trung vào các thông số cấu hình cần thiết.

Cài đặt Plugin:

Việc đầu tiên, chúng ta cần kiểm tra các thông số của Check_MK agent để biết nơi lưu trữ các file cấu hình:

root@linux# grep MK_LIBDIR /usr/bin/check_mk_agent
export MK_LIBDIR="/usr/lib/check_mk_agent"
PLUGINSDIR=$MK_LIBDIR/plugins
LOCALDIR=$MK_LIBDIR/local

Nếu thư mục plugin chưa có, chúng ta sẽ tạo:

root@linux# mkdir -p /usr/lib/check_mk_agent/plugins
root@linux# cp mk_oracle /usr/lib/check_mk_agent/plugins
root@linux# chmod 755 /usr/lib/check_mk_agent/plugins/mk_oracle

Plugin sẽ tự động phát hiện ra ORACLE instances dựa vào running processes như ora_pmon_....

Cấu hình thông số kết nối db Oracle:
 Các thông số kết nối db Oracl sẽ được khai báo thông qua file:  mk_oracle.cfg

Trước tiên, chúng ta cần cấp quyền truy cập vào db:

Tạo database user:

root@linux# su - oracle
oracle@linux:~> export ORACLE_SID=
oracle@linux:~> sqlplus / as sysdba
sqlplus> create user m_vnsysadmin identified by m_vnsysadminpwd;
sqlplus> grant select_catalog_role to check_mk;
sqlplus> grant create session to check_mk;
sqlplus> connect m_vnsysadmin/m_vnsysadminpwd
sqlplus> exit
oracle@linux:~> export ORACLE_SID=

Tạo ASM Instance user

Trong môi trường Oracle RAC (Real Application Cluster), ASM Instance sử dụng +ASM thay cho ORACLE_SID.

root@linux# su - oracle
oracle@linux:~> ps ax | grep pmon | grep ASM
oracle@linux:~> export ORACLE_SID=+ASM
oracle@linux:~> sqlplus / as sysasm
sqlplus> create user m_vnsysadmin identified by m_vnsysadminpwd;
sqlplus> grant sysdba to m_vnsysadmin;
sqlplus> exit

Khai báo thông số cho mk_oracle.cfg
File này thường nằm ở $MK_CONFDIR

Các thông số cấu hình thường như sau:


usernameempty
passwordempty
sysdbaempty
hostnamelocalhost
listenerport1521
ASMUSERusername:password:sysdba:hostname:port
DBUSER
DBUSER_username:password:sysdba:hostname:port

Ví dụ: 
/etc/check_mk/mk_oracle.cfg

ASMUSER=m_vnsysadmin:m_vnsysadminpwd:sysdba
ASMUSER=m_vnsysadmin:m_vnsysadminpwd:sysdba:host1:1521
DBUSER=m_vnsysadmin:m_vnsysadminpwd
DBUSER=m_vnsysadmin:m_vnsysadminpwd:sysdba
DBUSER=m_vnsysadmin:m_vnsysadminpwd::host1
DBUSER=m_vnsysadmin:m_vnsysadminpwd:::1522
DBUSER=m_vnsysadmin:m_vnsysadminpwd:sysdba:host2:1522
# ORACLE_SID=ORCL
DB_USER_ORCL=m_vnsysadmin:m_vnsysadminpwd2
# ORACLE_SID=tux
DB_USER_tux=m_vnsysadmin:m_vnsysadminpwd3:sysdba
# environment variable TNS_ADMIN
export TNS_ADMIN=/u00/app/oracle/network/admin

Thông tin DBUSER và ASMUSER khai báo nhiều lần chỉ là ví dụ. Thực tế thì quất 1 lần thôi ^^!

Testing plugin:

Sau khi cấu hình đầy đủ các thông số như trên, chúng ta tiến hành test thử:

root@linux# export MK_CONFDIR="/etc/check_mk"
root@linux# /usr/lib/check_mk_agent/plugins/mk_oracle -t

---oracle_instance---
---oracle_sessions---
---oracle_logswitches---
---oracle_undostat---
---oracle_recovery_area---
---oracle_processes---
---oracle_recovery_status---
---oracle_longactivesessions---
---oracle_dataguard_stats---
---oracle_performance---
---oracle_tablespaces---
---oracle_rman---
---oracle_jobs---
---oracle_ts_quotas---
---oracle_resumable---
---oracle_locks---
---oracle_instance---
---oracle_asm_diskgroup---
-----------------------------------------------
Logincheck to Instance: +ASM  Version: 12.1
Login ok User: SYS on ora12c.local
SYNC_SECTIONS= instance
ASYNC_SECTIONS= asm_diskgroup
-----------------------------------------------
Logincheck to Instance: tux2  Version: 12.1
Login ok User: CHECK_MK on ora12c.local
SYNC_SECTIONS= instance sessions logswitches undostat recovery_area processes recovery_status longactivesessions dataguard_stats performance
ASYNC_SECTIONS= tablespaces rman jobs ts_quotas resumable locks

Kết quả trên hệ thống Monitoring:


Chúc các bạn thành công. :)

Giải pháp giám sát hạ tầng mạng miễn phí với Nagios - update2

 CẬP NHẬT NAGIOS CORE, NAGIOS PLUGIN CHECK_MK, PNP4NAGIOS

Chào các bạn,
Tiếp theo bài giới thiệu về "Giải pháp giám sát hạ tầng mạng miễn phí với Nagios - update1".
Trong bài viết nà, tôi sẽ hướng dẫn update PNP4NAGIO và kiểm tra lại các thông số cấu hình để thu thập dữ liệu tạo chart/graph

1/ Tải file: https://sourceforge.net/projects/pnp4nagios/files/latest/download?source=files

2/ Quăng file pnp4nagios-0.6.25.tar.gz vào /tmp
3/ Thực hiện update:
cd /tmp
tar xvxf pnp4nagios-0.6.25.tar.gz
cd pnp4nagios-0.6.25
./configure
make all
make fullinstall


*** Configuration summary for pnp4nagios-0.6.25 03-01-2015 ***

  General Options:
  -------------------------         -------------------
  Nagios user/group:                nagios nagios
  Install directory:                /usr/local/pnp4nagios
  HTML Dir:                         /usr/local/pnp4nagios/share
  Config Dir:                       /usr/local/pnp4nagios/etc
  Location of rrdtool binary:       /usr/bin/rrdtool Version 1.3.8
  RRDs Perl Modules:                FOUND (Version 1.3008)
  RRD Files stored in:              /usr/local/pnp4nagios/var/perfdata
  process_perfdata.pl Logfile:      /usr/local/pnp4nagios/var/perfdata.log
  Perfdata files (NPCD) stored in:  /usr/local/pnp4nagios/var/spool

  Web Interface Options:
  -------------------------         -------------------
  HTML URL:                         http://localhost/pnp4nagios
  Apache Config File:               /etc/httpd/conf.d/pnp4nagios.conf


*** Main program, Scripts and HTML files installed ***

Enjoy.

[root@vnsysadmin.com pnp4nagios-0.6.25]#
Kiểm tra thử url sau xem chạy không: http://<ip>/pnp4nagios/graph
Nếu mọi thứ OK hết thì xóa file cài đặt:
rm -rf /usr/local/pnp4nagios/share/install.php

4/ Kiểm tra lại các file cấu hình:
Bước này cực kỳ quan trọng:
Verify config:

# wget http://verify.pnp4nagios.org/verify_pnp_config

# perl verify_pnp_config --mode bulk --config=/usr/local/nagios/etc/nagios.cfg --pnpcfg=/usr/local/pnp4nagios/etc

Nếu như thông báo như trên thì lỗi rồi đấy ^^!

5/ Sửa các thông số trên Nagios để cho phép pnp4nagios thu thập dữ liệu:

vim /usr/local/nagios/etc/nagios.cfg

process_performance_data=1

host_perfdata_file=/usr/local/pnp4nagios/var/host-perfdata
service_perfdata_file=/usr/local/pnp4nagios/var/service-perfdata

host_perfdata_file_template=DATATYPE::HOSTPERFDATA\tTIMET::$TIMET$\tHOSTNAME::$HOSTNAME$\tHOSTPERFDATA::$HOSTPERFDATA$\tHOSTCHECKCOMMAND::$HOSTCHECKCOMMAND$\tHOSTSTATE::$HOSTSTATE$\tHOSTSTATETYPE::$HOSTSTATETYPE$\tHOSTOUTPUT::$HOSTOUTPUT$
service_perfdata_file_template=DATATYPE::SERVICEPERFDATA\tTIMET::$TIMET$\tHOSTNAME::$HOSTNAME$\tSERVICEDESC::$SERVICEDESC$\tSERVICEPERFDATA::$SERVICEPERFDATA$\tSERVICECHECKCOMMAND::$SERVICECHECKCOMMAND$\tHOSTSTATE::$HOSTSTATE$\tHOSTSTATETYPE::$HOSTSTATETYPE$\tSERVICESTATE::$SERVICESTATE$\tSERVICESTATETYPE::$SERVICESTATETYPE$\tSERVICEOUTPUT::$SERVICEOUTPUT$
host_perfdata_file_mode=a
service_perfdata_file_mode=a
host_perfdata_file_processing_interval=15
service_perfdata_file_processing_interval=15

host_perfdata_file_processing_command=process-host-perfdata-file
service_perfdata_file_processing_command=process-service-perfdata-file

vim /usr/local/nagios/etc/objects/commands.cfg

define command{
command_name process-service-perfdata-file
command_line $USER1$/process_perfdata.pl --bulk=/usr/local/nagios/var/serviceperfdata
}
define command{
command_name process-host-perfdata-file
command_line $USER1$/process_perfdata.pl --bulk=/usr/local/nagios/var/hostperfdata
}

vim /usr/local/nagios/etc/objects/templates.cfg


define host {
name            host-pnp
action_url      /pnp4nagios/index.php/graph?host=$HOSTNAME$&srv=_HOST_
register        0
}

define service {
name            srv-pnp
action_url      /pnp4nagios/index.php/graph?host=$HOSTNAME$&srv=$SERVICEDESC$
register        0
}

define host {
    use                     linux-server,host-pnp
    host_name               ubuntu
    alias                   ubuntu
    address                 127.0.0.1
}

define service {
    use                             local-service,srv-pnp
    host_name                       ubuntu
    service_description             PING
    check_command                   check_ping!100.0,20%!500.0,60%
}

cp /usr/local/pnp4nagios/etc/rra.cfg-sample /usr/local/pnp4nagios/etc/rra.cfg

service nagios restart.

Chúc các bạn thành công. :)

Giải pháp giám sát hạ tầng mạng miễn phí với Nagios - update1

 CẬP NHẬT NAGIOS CORE, NAGIOS PLUGIN CHECK_MK, PNP4NAGIOS

Chào các bạn,
Tiếp theo bài giới thiệu về Giải pháp giám sát hạ tầng mạng với Nagios core:

  •     Monitor your entire IT infrastructure
  •     Spot problems before they occur
  •     Know immediately when problems arise
  •     Share availability data with stakeholders
  •     Detect security breaches
  •     Plan and budget for IT upgrades
  •     Reduce downtime and business losses
 Trong bài viết này tôi chia sẻ các bước cập nhật hệ thống giám sát lên phiên bản mới nhất gồm các thành phần: Nagios core, nagios plugin check_mk, pnp4nagios:


Đầu tiên là chúng ta cần tải các file trên bỏ vào /tmp, sau đó tiến hành nâng cấp hệ thống:

Nagios Core 4:
tar xvzf nagios-4.3.1.tar.gz
cd nagios-4.3.1
./configure --with-command-group=nagcmd
make all
make install

/usr/local/nagios/bin/nagios -v /usr/local/nagios/etc/nagios.cfg

service nagios restart

Nagios plugin:

tar xvzf nagios-plugins-2.1.4.tar.gz
cd nagios-plugins-2.1.4
./configure --with-nagios-user=nagios --with-nagios-group=nagcmd
make
make install
/usr/local/nagios/bin/nagios -v /usr/local/nagios/etc/nagios.cfg
service nagios restart

Check_MK:
tar xvzf check_mk-1.2.8p18.tar.gz
cd check_mk-1.2.8p18
./setup
/usr/local/nagios/bin/nagios -v /usr/local/nagios/etc/nagios.cfg
service httpd restart
service nagios restart
cmk -R

Hoàn thành quá trình nâng cấp Nagios core, nagios plugin, check_MK.

Chúc các bạn thành công.

Bài viết tiếp theo tôi sẽ hướng dẫn nâng cấp PNP4NAGIOS - một add-on  tuyệt vời cho Nagios, dựa vào RRD (Round Robin Databases) để thu thập dữ liệu, từ đó view những dữ liệu thu thập được thành chart/graph cho người quản trị có cái nhìn trực quan hơn về các host/service trong hệ thống.


Giải pháp giám sát hạ tầng mạng với Nagios core

Nhân tiện đang nâng cấp hệ thống giám sát hạ tầng mạng cho khách hàng nên tôi cập nhật lại bài viết "IT Infrastructure Monitoring" trước đây từng chia sẻ trên http://www.lecuong.info, http://blog.banbeit.com và một số site khác.
Tham khảo các bài viết cũ tại:

Bài viết này sẽ giới thiệu thêm và hướng dẫn nâng cấp hệ thống giám sát trên nền tảng Nagios lên phiên bản mới nhất.


Với Nagios Core (open source) hoàn toàn miễn phí, chúng ta có thể làm được rất nhiều thứ:
  • System Monitoring: complete monitoring of desktop and server operating systems – including system metrics, service states, process states, performance counters, event logs, applications (IIS, Exchange, Apache, MySQL, etc), and services (Active Directory, DHCP, Sendmail, etc). Nagios supports monitoring of Windows, Linux, Unix, Solaris, AIX, HP-UX, and Mac OS/X operating systems.
  • Protocol Monitoring (SNMP, HTTP, SSH, FTP, SMTP, Protocol TCP/UDP)....: complete monitoring of network protocols – including TCP/IP and UDP protocols. Implementing effective network protocol monitoring with Nagios offers increased server, services, and application availability, as well as fast detection of network outages and protocol failures.
  • Application Monitoring: complete monitoring of applications and application state – including Windows applications, Linux applications, Unix applications, and Web applications. Implementing effective application monitoring with Nagios offers the following benefits: increased server, services, and application availability, fast detection of network outages and protocol failures, and fast detection of failed services, processes and batch jobs.
  • Database Monitoring: complete monitoring of database servers and databases – including availability, database and table sizes, cache ratios, and other key metrics. Implementing effective database monitoring with Nagios offers increased application availability, increased database performance, fast detection of database outages, failures, and table corruption, predictive analysis of storage requirements and index performance.
  • Log Monitoring
  • Bandwidth Monitoring
----------

Một số hình ảnh về hệ thống giám sát phiên bản nâng cấp:

Tối ưu hóa hiệu suất hệ thống, tốn ít tài nguyên:


Giao diện trực quan, theo dõi & report chi tiết hơn:


Theo dõi chi tiết thông tin thiết bị mạng:


Theo dõi chi tiết trạng thái process:


Các bạn quan tâm, có thể tham khảo thêm về Nagios tại đây.


Trong bài viết tiếp theo, tôi sẽ hướng dẫn nâng cấp hệ thống Nagios cũ lên phiên bản mới. :)